Intro
Design
Airframe
Hardware
Software
Testing
Launch 5
Glossary
Links
Contact
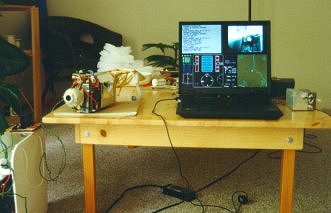
Hardware Testing
|
|
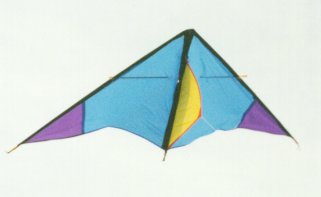
The Test-Drop Kite
Span is 2.6m, area about 1.7m2. It's homemade, made out of 1/2" dowel and spinnaker nylon scraps (i.e., cheaply). It was deliberately tuned to kite a bit pitch-down, so it would lift properly with a mass hanging from it, but fall when the mass was released. That way we didn't have to wind in 700 feet of line after every launch. We used two pulleys to get a high line speed from a running person. One to double the line speed, and another from a post, to reverse the line direction so the "mule" puller could run back towards the kite (allowing a higher launch in a given space). In use, we could achieve an altitude of about half the field length in almost no wind. One thing to recommend for anyone using this method is to use good quality,
braided, 90 pound test line. On our first attempt at lofting the glider, the
line broke at about 75' altitude, causing a nasty nose dive and about a week of repair work.
|
Chute and Cut-Device Drops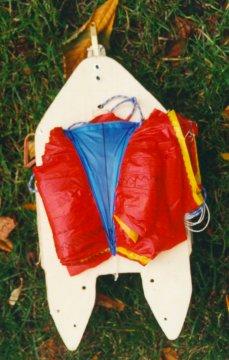 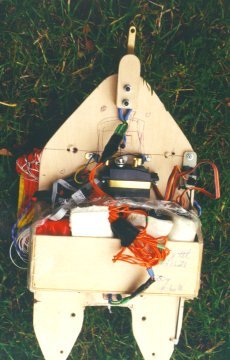
|
|
The R/C skydiver test rig. This field tested the chute, the cut-away circuits,
and both the chute and tail line-cutting devices. We used an ordinary R/C aircraft
controller. You can see the tail-release device with line guide at
the top, and the chute-release device is at the bottom of the left hand
photo. The parachute itself weighs about 170 grams including all rigging, has
about 2 m square of area, with 12 gores, and a 10% diameter vent in the top that
results in a very stable descent with no oscillating. It's stressed (in theory) to
25g's of shock load.
We dropped it both by itself, and with a 2 L pop bottle full of water. It worked perfectly in around 7 drops, as you can see in the photo series below, and video (0.6mb, 16s) of the same drop test. This was, however, before I learned how to pack a conical parachute properly for staged opening - which can dramatically reduce opening shock at high speed. That probably saved the glider on at least one test flight. |
|
|
|
So, that's an old record player jerking on the side of the suspension line. It was fatiguing of the nicrome cut-wire that was the most expected problem, and the line guide at the tail seemed to do its job in protecting against that. But the 25-pound test nylon line it was suspended by fatigued at the knot in only 20 minutes. The setup was rigged up again, using 50 pound line, and with the glider in flight-simulator mode (dreaming of a balloon launch). It released properly after 90 minutes, and popped the chute hatch some time later. So now 50-pound line is used actual flight (probably 30 pound breaking strength given knots). In the field, there hasn't been the slightest problem with any of the cut circuits, cut devices, or various airframe joints. Perfect reliability on the cut devices so far, in dozens of uses, in all conditions of temperature and radio noise. [Note: The same bits of nicrome wire have been used now on 2 test days and 2 actual launches!] Later, the ready-to-go glider was also subjected to 5 minutes on top of an unhappy washing machine running in spin cycle. It passed with no problems, and later inspection showed that nothing had come lose. That's where the aviation standard practice of safety ties and lock-nuts for every little part pays off.
|
 Airframe Proof Loading Airframe Proof Loading
The airframe was originally designed for +9g ultimate strength, 6g yield, with the wings slightly stronger than the wing joiners. But weight gain over the course of the project meant this ended up actually amounting to 7.5g ultimate, 5g yield. |
|
The wing spar carry-through is built to 12g, and the primary fuselage structure to 75g+, to withstand landing and parachute opening-shock loads One of the first set of wings had a glue joint fail at about 4.5g in the wing joiner area during load testing. Luckily this was an easy repair/redesign, and on re-testing all of the airframe met the design load. Anal levels of testing prove their worth yet again! Both the original balsa/spruce wings and the new fibreglass/foam/spruce wings were tested in this way. The second set of wings passed their load testing with no issues at all.
Yes, the wingtips really are clear of the carpet! The bending and creaking was scary though. |
|
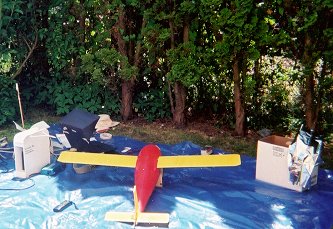
Airframe Flight Tests - Manual Control
Manual flight testing, using an ordinary R/C aircraft radio plus some ballast for balance, demonstrated that the airframe was trimmed properly and had no bad habits. It also helped to get a qualitative, and from the videos even quantitative, idea of how the airframe handled in flight - roll rates, etc. The glider was attached to the kite with the line from the kite strung through the parachute attach point above the wings, and then back to the tail release device. It's hard to find a nice, large and available field in our area though, which limits the altitude reached. So we never did get it high enough to test a parachute recovery of the glider more than just once, when there wasn't enough room for a final turn. On our first attempt, the kite line broke just after launch, and it dropped it from about 75 feet or so - not enough height to use the chute, but plenty to cause a lot of damage (face plant). At first we thought the airframe was a total loss, but the nose cone acted as a "crush zone" and took almost all the damage (as did the neighbourhood, with a single 120db utterance of **** from the test pilot echoing for miles). After that, we drop tested as little as we felt we could get away with, although all of our subsequent drops went fairly well. Here are a couple of them on video: A kite-launch of the glider with rudder-dihedral control (photo series above) (1.7mb, 20s) Ditto, but with the 2nd set of aileron-control wings, and on a nicer day (2.8mb, 30s)
Erstwhile ground crew (Steph and Owen),
|
|
Battery Endurance
|
|
Note that x-axis is in seconds. These trend lines are each for a single battery under baseline (low) radio transmitter usage, and at room temperature.
|
| Instrument Calibration |
Both the Pitot and Static sensors are from the Motorola mpx5000 series. They have performed fairly well, although the Pitot (5010) sensor has proved to have some temperature drift. Both sensors were calibrated with a simple water-column in tubing to provide pressure. |
As a result, in flight the static sensor calibration has turned out to be in error by as much as 3% over the full scale of 110kpasc, versus the 0.1% theoretical limit of the A-D converter. That was corrected after the first flight.
|
| Cold Tolerance |
 Deep-freeze tests of the low temperature endurance of the internal systems were also carried out, down to an internal temperature of -25c. All but one system worked perfectly with the guts-rack down to that temperature, while the computer itself was kept from going any lower than -10c or so by its mylar box. The lithium system-power battery packs lost some endurance at low temperature, as expected, but kept well within their spec. The one exception was the cut-circuits, whose nicad batteries failed to provide enough current to cut the nylon line below -15c or so. The flight-abort internal temperature limit was then set to be -10c, although in practice it has never fallen below 10c, even at 45,000 feet, with the outside temperature probably -50c. If the insulation works as designed, the internal temperature should never go below 0c. The whole fuselage, wings, and tail were also included in the cold test. The airframe reached a temperature as low as -30c or so. On the first cold test, all airframe parts showed little ill effect from this.
|
| Insulation Effectiveness and Heat Tolerance |
For the high temperature end, the glider was bench tested fully assembled with insulation. This affirmed that it would handle landing out and sitting for a while on a warm day, and also quantify how well the insulation worked. A fan helped ensure there was little insulation effect from a stagnant boundary layer on the fuselage. It went up to an internal temperature of about 35c, from 20c. Everything stayed within spec and worked perfectly. From the curve shown, a rough estimate of the insulation value and effective thermal mass of the fuselage was derived. The insulation value did not seem to be up to the intended value from this test, but it was still good enough to keep all the components within spec on the highest planned flight. [Note: the first balloon flight showed the real-world insulation effectiveness actually did meet the design spec]
|
|
Resistance to Hardware-Level Failures |
|
The ready-to go system was checked for its ability to recognize and respond intelligently to any given system or component being unplugged, de-fused, or given impossible instrument input. This included forcing resets and momentary power loss. Amazingly, it passed this one without a glitch. Typical recovery time from a reset is about 2 seconds to get to the point of up, running, and aware of what's going on. (Sorry, there are no good visuals for this one) |
|
Simulation Scenarios and Autopilot Trials |
 It seemed a
little crazy to test the autopilot by taking hardware representing months
of work, and then toss it up for low altitude test drops. Minimizing actual
flight time seemed the least expensive or painful route. It seemed a
little crazy to test the autopilot by taking hardware representing months
of work, and then toss it up for low altitude test drops. Minimizing actual
flight time seemed the least expensive or painful route.So for this purpose, a 6-degree of freedom physical flight simulator was developed. The glider's specs and masses were entered, and the glider flight model was then tweaked to qualitatively match the manual flight tests of the airframe at sea level as closely as possible. Each command, basic autopilot function, and expert-system level autopilot function was systematically tested in the flight simulation mode. Using real-world data from weather balloon sondes launched in nearby Washington state, found online, the autopilot's ability to fly the glider back through a variety of wind and weather conditions while completely self-guided was tested. A number of instrument failure modes were also tried. The minimum standard set for a balloon launch was a series of 20 successful flights, without self-resets or "virtual accidents", completed at least one week before an actual flight. The delay is prevent "milestone / delivery syndrome", a cause of business "accidents" all too familiar to anyone who has worked in the software industry. The simulator also proved valuable for practicing various scenarios where ground intervention or decision making might be required.
|
|
System Robustness in the Field |
|
We also ran a range check from one small local mountain to
another, and graphed the signal strength versus orientation for the antennas.
The safe radio range for reliable (>95%) data packet transmission
worked out to better than 200km in most antenna / glider orientations. |
 R/C sailplanes
are usually towed to altitude with an electric winch. So it seemed a good way to lift a heavy mass up,
assuming the
craft being "hi-started" had a low
wing loading, and the initial line speed was high. The glider by itself has
far too high a wing loading for this launch method, but a large delta kite fits the
bill - and can also lift other test items.
R/C sailplanes
are usually towed to altitude with an electric winch. So it seemed a good way to lift a heavy mass up,
assuming the
craft being "hi-started" had a low
wing loading, and the initial line speed was high. The glider by itself has
far too high a wing loading for this launch method, but a large delta kite fits the
bill - and can also lift other test items.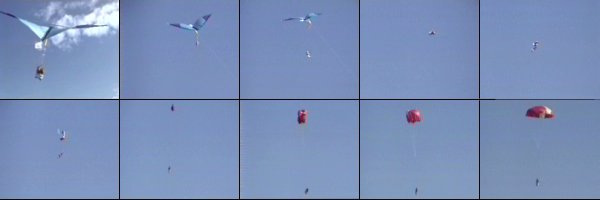
 Having no gut-level faith
that the
whole complex package would withstand an hour or so of wild swinging under the
balloon, or in-flight vibration, resistance to such abuse was tested for as
well.
Having no gut-level faith
that the
whole complex package would withstand an hour or so of wild swinging under the
balloon, or in-flight vibration, resistance to such abuse was tested for as
well.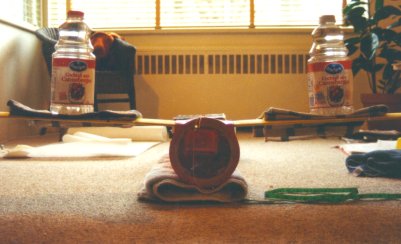 However,
in the simulations, the typical over-loading scenario is a spiral dive after
release due to a severe out of trim condition. Once the speed has build up to 5g
or so, the autopilot is just not able to sort out the situation, so any
real-world loading over 5g's is probably irrelevant.
However,
in the simulations, the typical over-loading scenario is a spiral dive after
release due to a severe out of trim condition. Once the speed has build up to 5g
or so, the autopilot is just not able to sort out the situation, so any
real-world loading over 5g's is probably irrelevant.


 You
just never know, until you test outside, in the real world. The glider was set up
as if ready-to-fly (except for the insulation), and run through a full pre-flight checklist and simulated
flight outside, in addition to driving it around some.
You
just never know, until you test outside, in the real world. The glider was set up
as if ready-to-fly (except for the insulation), and run through a full pre-flight checklist and simulated
flight outside, in addition to driving it around some.